Syntax
h = edges_hist_1d(x, edges, w)
Description
edges_hist_1d builds one-dimensional histogram with bins defined by edges parameter of values x with corresponding weights w. When the w parameter is not given the weight of every value of x is assumed to be 1.
Parameters
x
Vector of numeric values to put into the histogram.
edges
Sorted vector on numeric values defining the edges of the bins.
w
Vector of numeric values of the weights of corresponding values.
Return Values
h
Vector of length length(edges)-1</span of numeric values of the histogram.
Examples
Build a histogram of the values sequence from 1 to 5 into two-bin histogram.
ans =
11 9
Here the first bin results in 11 because only two values 1 and 2 fall into the interval [0; 3). These values have corresponding weights of 1 and 10 that in sum yields 11. The second bin is the sum of the weights 2, 3 and 4 corresponding to the values 3, 4 and 5. In this example unweighted (e.g. the weight of every value is 1) equivalent of x is:
2 2 2 2 2 2 2 2 2 2 … % w = 10
3 3 … % w = 2
4 4 4 … % w = 3
5 5 5 5] % w = 4
x =
Columns 1 through 11
1 2 2 2 2 2 2 2 2 2 2
Columns 12 through 20
3 3 4 4 4 5 5 5 5
>> photonscore.edges_hist_1d(x, [0 3 10])
ans =
11 9
Syntax
info = photonscore.file_info(filename)Description
file_info(filename) retrieves metadata from the file given by filename.
Parameters
filename String specifying path to a .PHOTONS file.
Return values
info Structure holding file information with the following fields:
aat_frequenctyNumeric value specifying frequency of absolute arrival time clock in Hz.createdString value formatted as a date and time of file eation.detector_guidString holding globally unique LINCam system identifier.dt_channelNumeric value of ΔT channel width in picoseconds.dt_biasNumeric value of TAC bias as set by the user in acquisition program.durationNumeric value of total duration of the recorded photon streams in seconds.file_guidString holding globally unique file identifier.photons_countNumeric 64 bit integer numeric value of total number of recorded photons.raw_info_cell array of all metadata read from the file in raw form;
Examples
Get the information about gfp.photons file.>> photonscore.file_info('gfp.photons')
ans =
struct with fields:
photons_count: 59905889
raw_info_: {26×3 cell}
created: '2019-02-28 14:31:23.166'
file_guid: '{d47b5c6b-bd16-401a-97ea-e63e58e872ee}'
dt_bias: 4095
dt_channel: 23.2900
aat_frequencty: 100000000
detector_guid: '{961a443c-697d-426b-b991-2abe8485695c}'
duration: 353.4260Syntax
data = file_read(filename, dataset)
data = file_read(filename, dataset, offset, count)
Description
data = file_read(filename, dataset)
data = file_read(filename, dataset, offset, count)
Parameters
filename
dataset
offset
count
Return values
data
Examples
Read an allx positions of the photons in the file 'gfp.photons':
>> photonscore.file_read('gfp.photons', '/photons/x')
ans =

  59905889×1 uint16 column vector

   2904
   1519
   1876
   1803
   1997
   1858
   1379
   2111
   3467
   1867
....>> photonscore.file_read('gfp.photons', '/photons/x', 3, 5)
ans =
5×1 uint16 column vector
1803
1997
1858
1379
21111803 offset parameter value 3 is given.Syntax
rgb = photonscore.flim.iw_tau(i, l);
rgb = photonscore.flim.iw_tau(i, l, pal);
rgb = photonscore.flim.iw_tau(i, ri, l, rt, pal);
Description
iw_tau(i, l) computes rgb image of the intensity i weighted lifetime l using 'preview.png' palette
iw_tau(i, l, pal) computes rgb image of the intensity i weighted lifetime l using pal palette.
iw_tau(i, ri, l, rt, pal) computes rgb image of the intensity weighted i lifetime l using pal palette cropping the dynamic range of intensity i into the range ri and limiting values of l into rl range.
There are four palettes bundled with Photonscore toolbox:

Parameters
i
ri
0 counts up to a value that cut the to 10% off.i
li
pal
imread function in the working directory. Than the build-in palettes path will be used to find the file.Syntax
[medi, mea] = photonscore.flim.medimean(fl)
[medi, mea] = photonscore.flim.medimean(fl, range)
Description
medimean(fl, range) loops through the sorted dataset fl computed by flim.sort function and returns median and mean lifetime images where dt falls inside range.
Parameters
fl
range
Syntax
fli = photonscore.flim.sort(x, x_min, x_max, x_bins, y, dt)
fli = photonscore.flim.sort(x, x_min, x_max, x_bins, ...
                            y, y_min, y_max, y_bins, dt)
Description
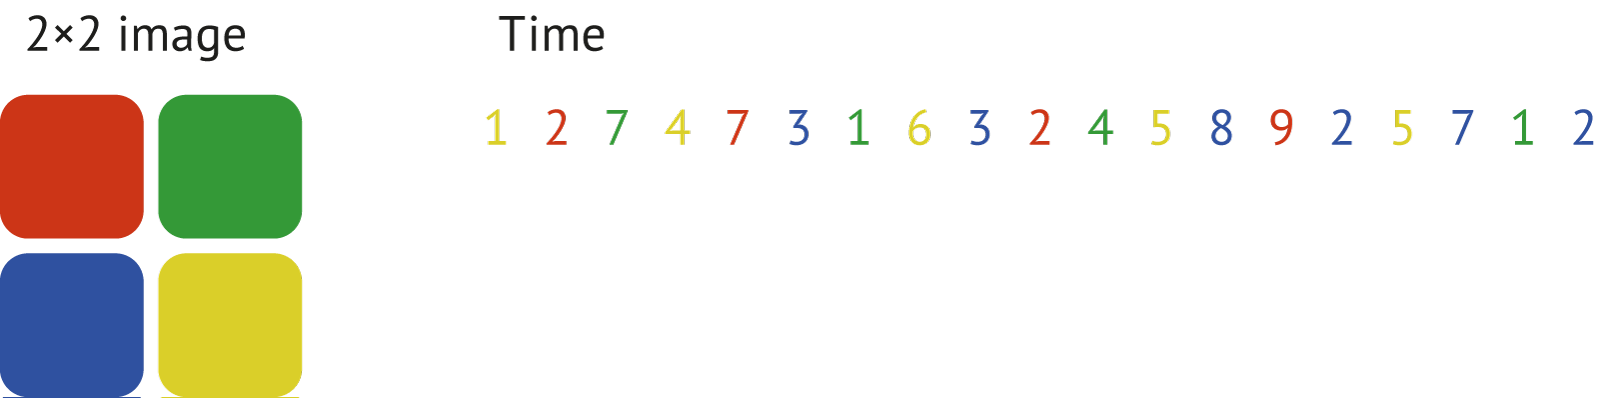
photonscore.flim.sort builds a 2D histogram of the positions x and y in the half-closed intervals [x_min, x_max) and [x_min, x_max) with the number of bins defined by x_bins and y_bins. If the histogramming options for y are not provided those for x are used, e.g. y_min = x_min, y_max = x_max and y_bins = x_bins. The values of dt are ordered from smaller to larger.
To illustrate the operation of the sorting function consider the dataset of 2×2 positional bins marked with the colors and corresponding dt values:
 After applying
 photonscore.flim.sort the resulting image (histogram) and the corresponding time values would look like shown here:
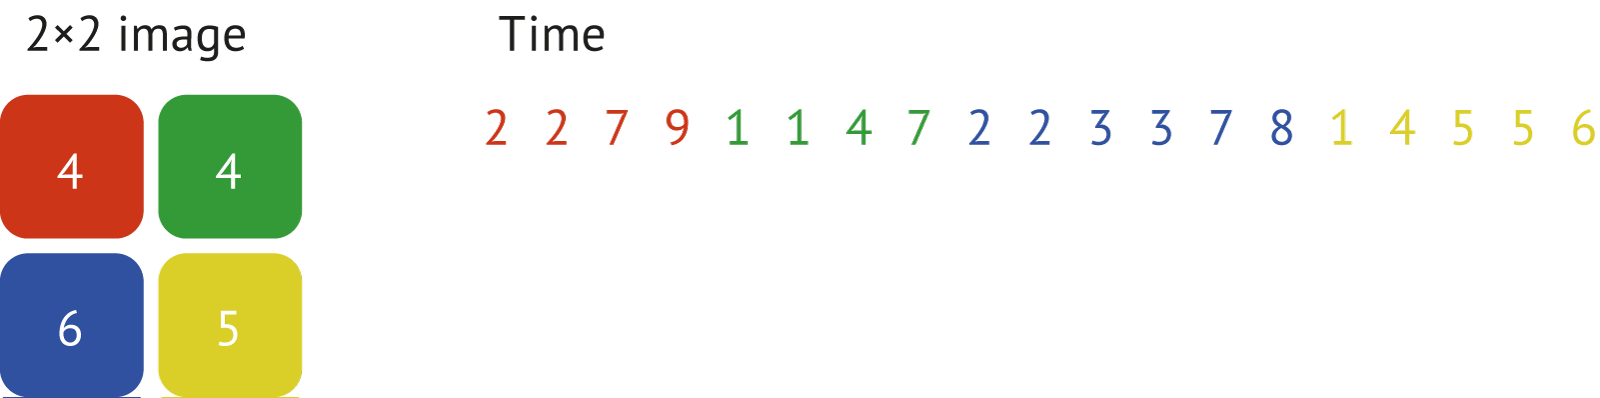 The benefit of this data organization is an ability to extract very fast fluorescence decays for corresponding positions.
Parameters
x, y
x_min, x_max, x_bins
x.y_min, y_may, y_bins
y.dt
Return values
fli structure with the following fields:
imagex_bins×y_binsmatrix of integer values holding number of counts of the bin.timeis the vector of sorted numeric values ofdtparameter.
Example
To reproduce the results depicted above one can use the following code fragment:>> x = uint16([2 1 2 2 1 1 2 2 1 1 2 2 1 1 1 2 1 2 1]);
>> y = uint16([2 1 1 2 1 2 1 2 2 1 1 2 2 1 2 2 2 1 2]);
>> dt = uint16([1 2 7 4 7 3 1 6 3 2 4 5 8 9 2 5 7 1 2]);
>> fl = photonscore.flim.sort(x, 1, 3, 2, y, dt);>> fl
fl =
struct with fields:
image: [2×2 int32]
time: [19×1 uint16]
>> fl.image'
ans =
2×2 int32 matrix
4 4
6 5
>> fl.time'
ans =
1×19 uint16 row vector
2 2 7 9 1 1 4 7 2 2 3 3 7 8 1 4 5 5 6Syntax
h = hist_1d(x, x_min, x_max, x_bins)
h = hist_1d(x, x_min, x_max, x_bins, type)

h = hist_2d(x, x_min, x_max, x_bins, y)
h = hist_2d(x, x_min, x_max, x_bins, y, type)
h = hist_2d(x, x_min, x_max, x_bins,...
            y, y_min, y_max, y_bins)
h = hist_2d(x, x_min, x_max, x_bins,...
            y, y_min, y_max, y_bins, type)

h = hist_3d(x, x_min, x_max, x_bins, y, z)
h = hist_3d(x, x_min, x_max, x_bins, y, z, type)
h = hist_3d(x, x_min, x_max, x_bins,...
            y,...
            z, z_min, z_max, z_bins)
h = hist_3d(x, x_min, x_max, x_bins,...
            y,...
            z, z_min, z_max, z_bins, type)
h = hist_3d(x, x_min, x_max, x_bins,...
            y, y_min, y_max, y_bins,...
            z, z_min, z_max, z_bins)
h = hist_3d(x, x_min, x_max, x_bins,...
            y, y_min, y_max, y_bins, ...
            z, z_min, z_max, z_bins, type)
Description
hist_1d builds one-dimensional histogram of the values x in the half-closed interval [x_min, x_max) that is split into x_bins equally sized bins.
hist_2d build two-dimensional histogram of the values x and y in half-closed intervals [x_min, x_max) for x and [y_min, y_max) for y split into x_bins and y_bins respectively.
hist_3d build three-dimensional histogram of the values x, y and z in half-closed intervals [x_min, x_max) for x, [y_min, y_max) for y and [z_min, z_max) for z split into x_bins, y_bins and z_bins respectively.
Parameters
x, y, z
x_min, x_max, x_bins
x.y_min, y_may, y_bins
y.z_min, z_maz, z_bins
z.type
uint8, uint16, uint32, int8,int16, int32, single and doubleReturn values
Returns a histogram as a vector of numeric values.Examples
In this example the function count the number of events falling into the intervals[2, 3) and [3, 4]. From the input vector only value 2 falls into the first bin and two values (3 and 3.4) are inside the second interval.
>> photonscore.hist_1d([1 2 3 3.4 5 10], 2, 4, 2)

ans =

     1
2[-3, 3) with 100 bins.
>> x = -3:0.06:2.94;
>> h = photonscore.hist_1d(randn(1000, 1), -3, 3, 100);
>> stairs(x, h)
This example uses
 10000 normally distributed values for x values and distorted for y.
>> x = randn(10000, 1);
>> y = randn(10000, 1)/3 + x.^3/3;
>> imagesc(photonscore.hist_2d(x, -3, 3, 100, y))
>> colorbar
Syntax
data = read_photons(filename)
data = read_photons(filename, range_seconds)
Description
read_photon(filename)
read_photon(filename, range_seconds)
Parameters
filename
range_seconds
Return values
data Structure holding the requested range of the data with the fields:
xHorisontal photon positionyVertical photon positiondtPicosecond timing
Examples
Read the whole file into the memory.>> photonscore.read_photons('gfp.photons')
ans =
struct with fields:
x: [59905824×1 uint16]
y: [59905824×1 uint16]
dt: [59905824×1 uint16]>> photonscore.read_photons('gfp.photons', [3 4.2])
ans =
struct with fields:
x: [203613×1 uint16]
y: [203613×1 uint16]
dt: [203613×1 uint16]