Fluorescence Lifetime Imaging (FLIM)
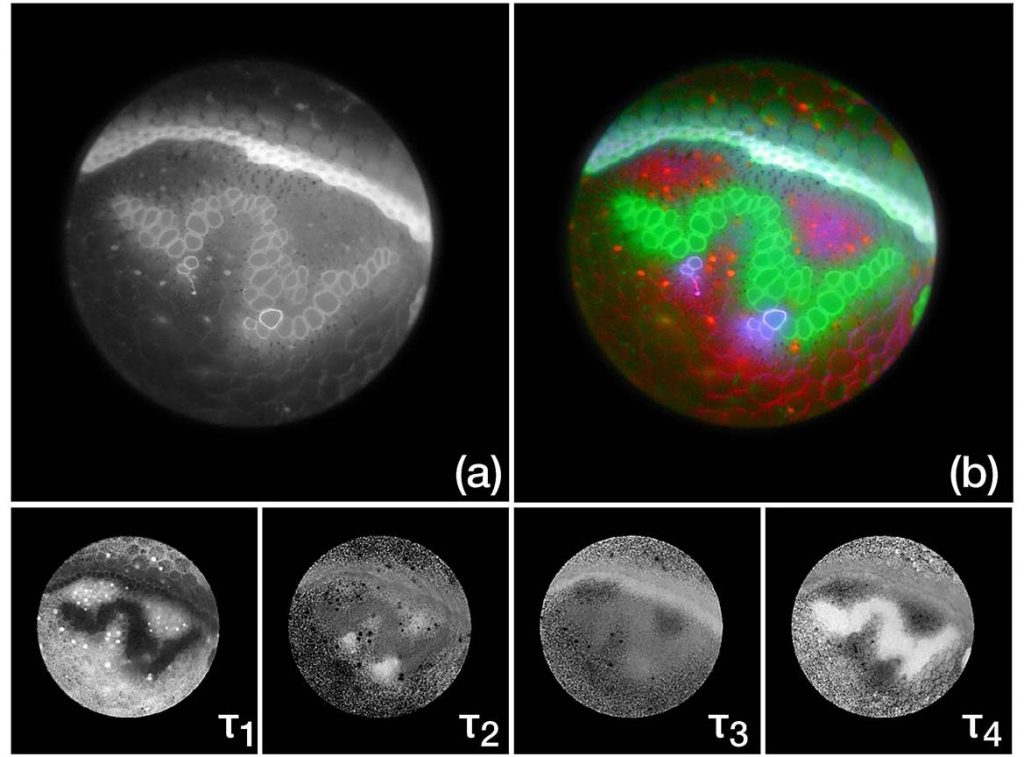
Example of lifetime imaging of a lily of the valley slice sample. The intensity image (a) is a histogram of the positions of acquired photons. Lifetime analysis reveals four lifetime components: τ1 = 0,19; τ2 = 0,67; τ3 = 1,95 and τ4 = 3,75 ns. The resulting overlay image (b) of the intensity image and average lifetime is shown.